
Are you aware of the Tooltip functionality in Power BI? In this blog we’ll explain what tooltips in Power BI do and how they can be used to your organisation’s advantage.
What is Power BI Tooltips?
To explain Tooltips to you, first we need to dive into what Power BI is. Microsoft Power BI has developed into one of the leading business intelligence solutions in recent years. Power BI, which is part of Microsoft’s Power Platform, allows a wide spectrum of business users, from IT professionals and data analysts to non-tech workers, to develop, share and utilise insights gathered from different data sources.
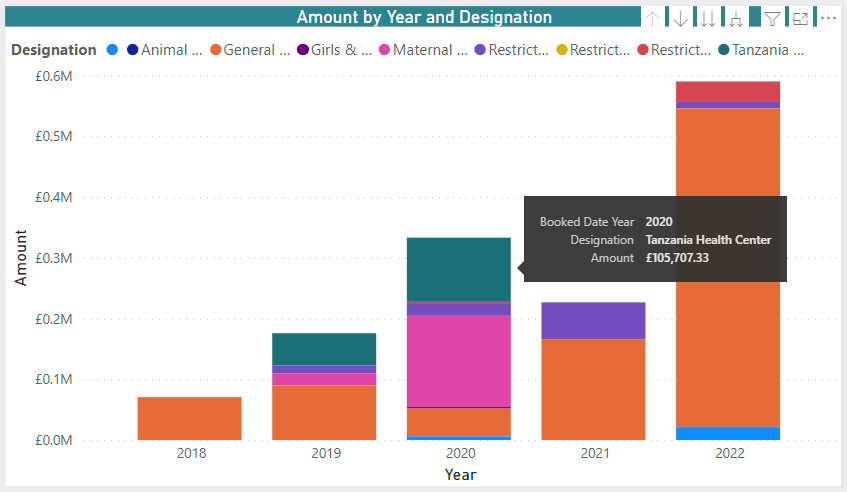
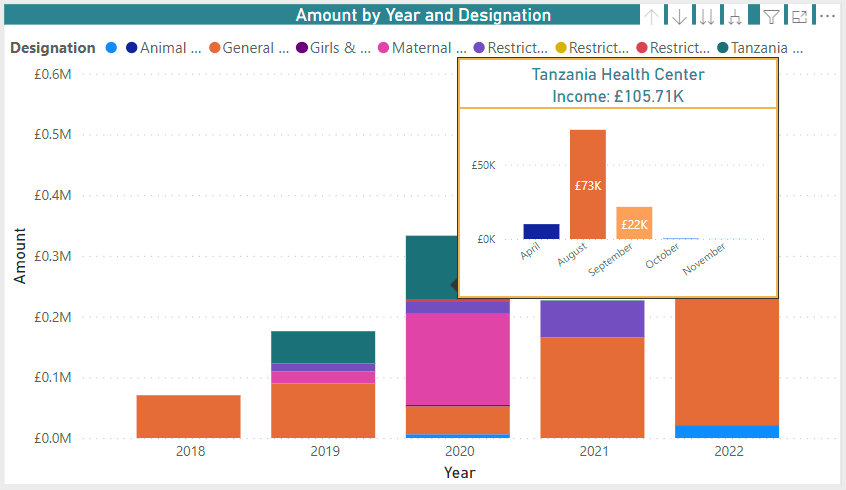
Tooltips are a Power BI resource that provide a simple and elegant way of displaying more contextual data and information in detail into points on a visual. The values and categories can be highlighted when visualisation is offered with the aid of tooltips.
You can also utilise customisable tooltips to deliver the information more precisely. The usage of customisation in tooltips can provide users with more information and context. Tooltips allow users to point to extra data items that are included in the Tooltip.
Many enhancements are applied to Power BI reports to strengthen their reporting style. The tooltips show whenever the cursor travels over a visual. There won’t be tooltips for every visual. Tooltips are highly helpful since they provide in-depth database trends. A hint, info tip, or screen tip are other names for Tooltips.
How Does Tooltip Work In Power BI?
The Tooltip Icon in Power BI functions more like a screen hint or tip. Tooltips uses in Power BI are listed below:
- Visual Annotations
- Calculations / Business Logic
- How to navigate around the visual
- Show more data related to visual
- Visual Annotations
Annotations can be viewed interactively in today’s digital environment. You may appreciate the little annotations for daily reporting with tooltips. The canvas space in Power BI can be utilised more effectively with the assistance of these tooltips. Among the other uses is business logic. Tooltips make it simple to provide an explanation of the calculations. Here, each is working towards the same objective, therefore tooltips will be a quick and practical way to make metrics more understandable. Visual Tooltips will provide you with that little bit of extra detail that you may need.
How to navigate around the visual
To easily explain each measure is not so simple. You will thus need some extra features, such as tooltips and drill down and drill up functionalities. Tooltips can therefore be useful and practical for handling this better. With the right guidance, tooltips can help you comprehend things quickly.
Tooltips allow you to concentrate on just one area. It will be beneficial to focus on it and display only relevant data. The user will find this to be very helpful. Here, tooltips can be very useful.
How To Add Tooltips On Report Pages In Power BI (Area that needs screen shots)
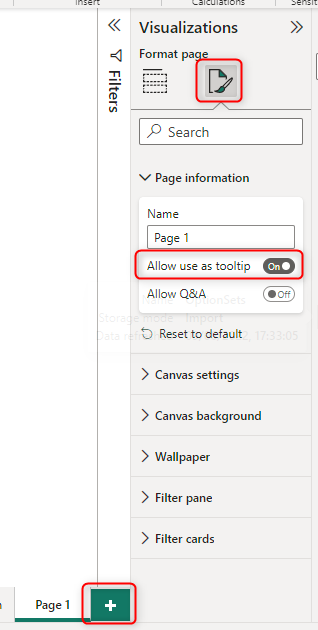
- First, create a new page, and on that new page you will need go to the formatting options.
- Under page information you will need to turn on Allow as tooltip

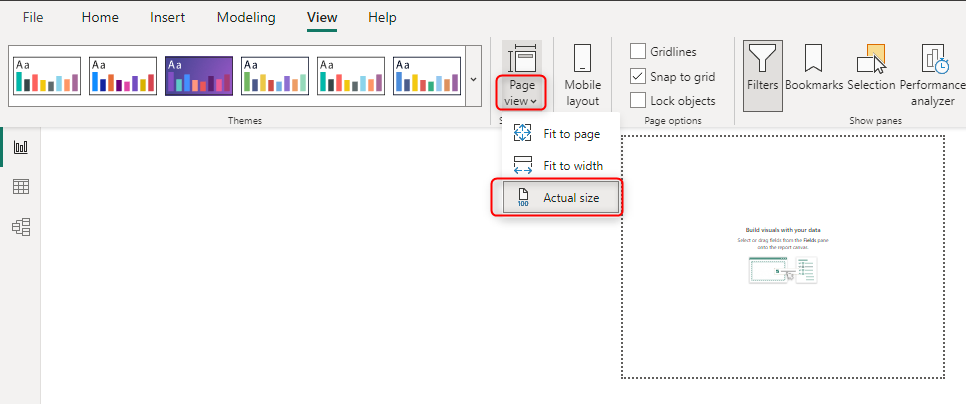
- You have to make sure the page view is set to Actual Size. You have to use the actual canvas space with the Tooltip.

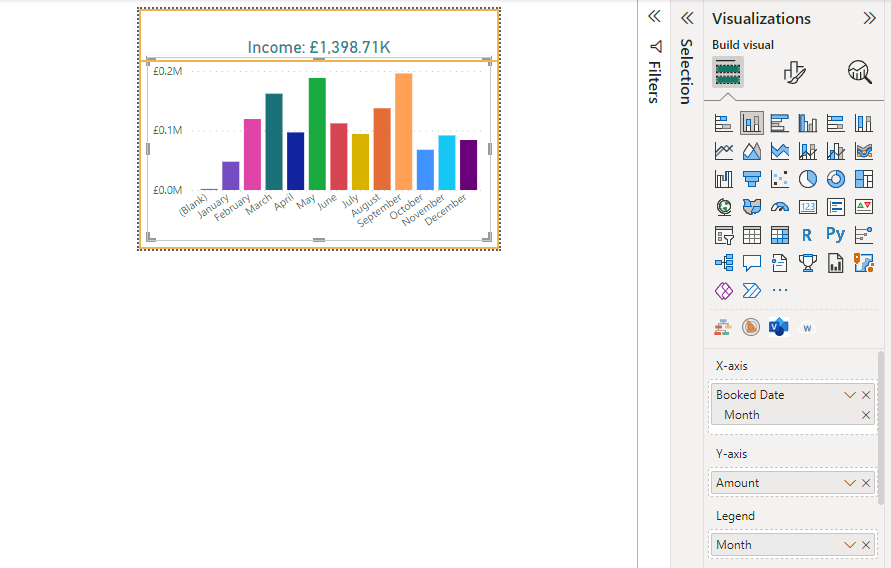
- Building your tooltip can now begin. Any mix of visuals can be used for that. It’s exactly the same as building a report in Power BI.

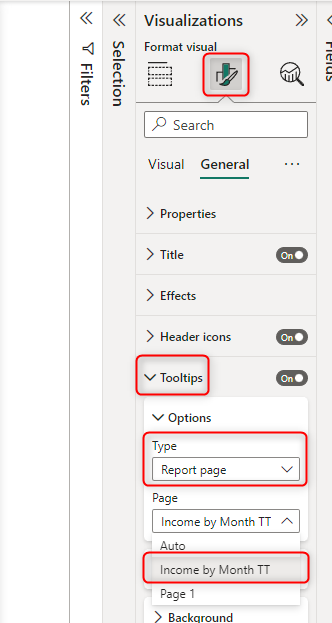
- Lastly, apply this to the chart you intend to use. Choose your chart by navigating to it. Next choose the Tooltip you just made under Page and turn on the Tooltip.


Although some individuals find tooltips more of a nuisance, there are more benefits than drawbacks.
- Tooltips can be used to provide contextual assistance, much like they do for messages and hints on your website.
- People typically don’t use something they don’t fully comprehend. Users can better understand the system’s complicated features with the aid of tooltips.
- A tooltip will guide users to the accurate information and provide guidance in the form fields.
This is how Power BI Tooltips function. They facilitate and improve visual representation. Users have the ability to simply configure a tooltip, allowing them to produce more interactive reports. If you’re interested in learning more about Power BI, feel free to get in touch with us.